Explainer
How to Read a Median Home Value
The Census home value on a city profile isn't an appraisal, a sale price, or a Zillow estimate. It's what owners think their homes are worth — and that changes how you should read it.
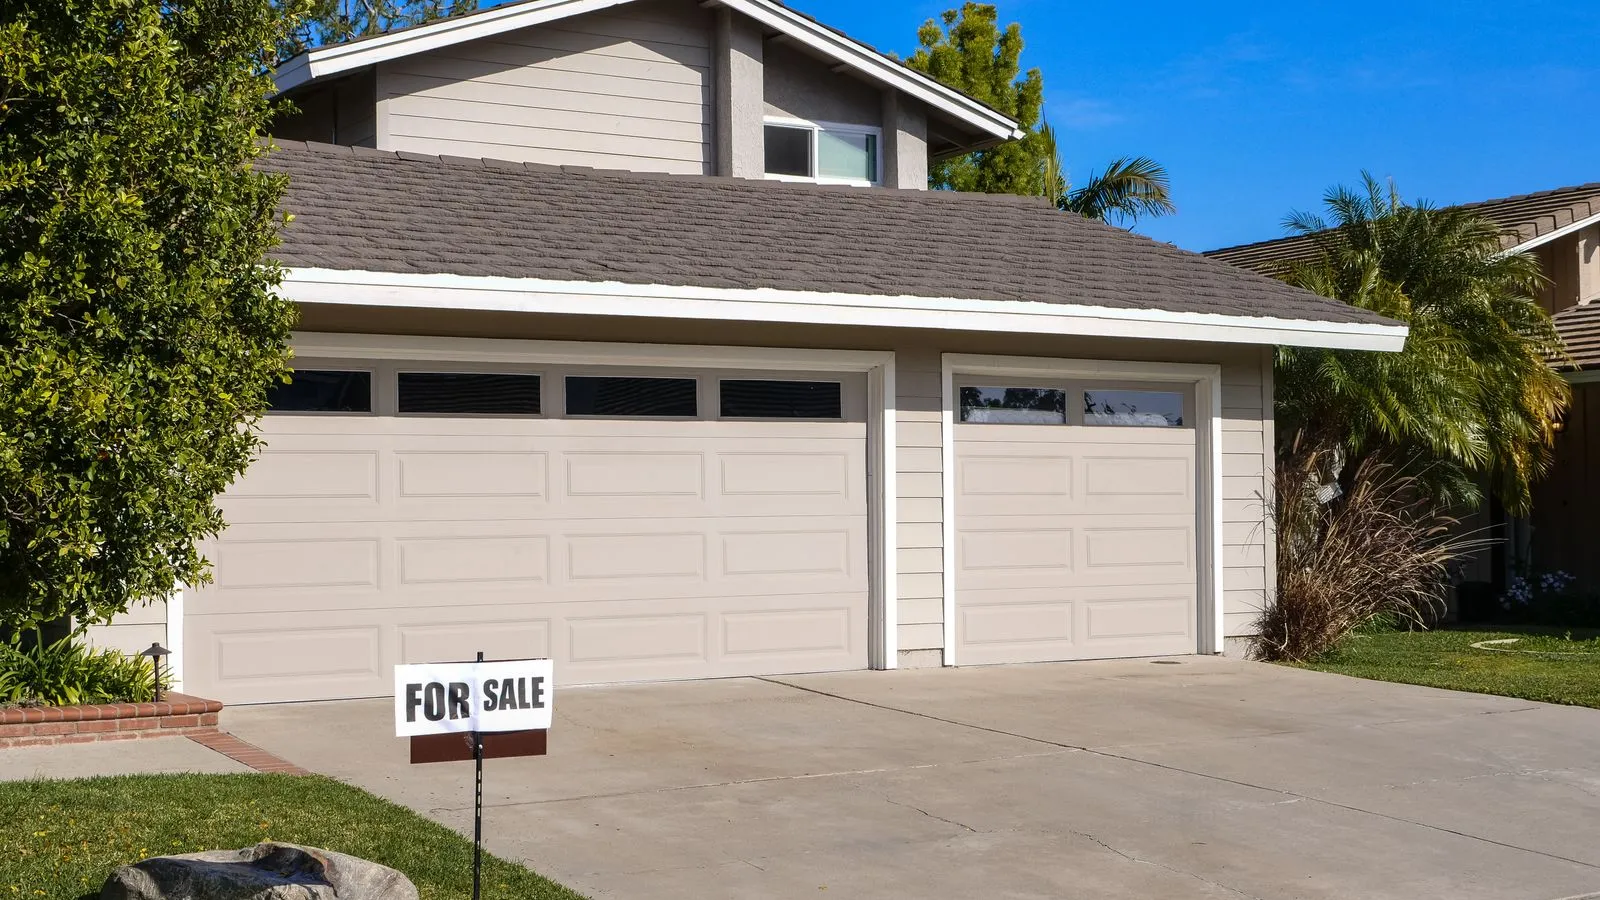
The median home value on a city profile is one of the most useful numbers we publish and one of the most misunderstood. People read it as if it were the local sale price, or an appraisal, or a Zillow “Zestimate.” It’s none of those. Understanding where the figure actually comes from — and what it deliberately leaves out — is the difference between using it well and drawing the wrong conclusion about what it costs to live somewhere. Nationally, that figure sits at about $332,700.
It’s what owners think their home is worth
Here’s the surprise at the center of the statistic: the Census Bureau’s median home value is based on owners’ own estimates. The American Community Survey asks homeowners a direct question — roughly, “What do you think this house and lot would sell for if it were for sale?” — and the published value is the median of those self-reported answers.
That design has real consequences. It means the figure is a self-assessment, not a market transaction or a professional valuation. Research has long found that owners’ estimates are reasonably accurate in aggregate but tend to run a little high — people are optimistic about their own homes — and can lag the market, since an owner’s sense of value updates more slowly than actual sale prices do. In a fast-moving market, self-reported values can trail what homes are really trading for.
It also means the figure covers a specific slice of housing: owner-occupied homes only. Rentals aren’t in it. So in a heavily renter-dominated city, the median home value describes the minority of homes that owners live in, which may not represent the housing stock as a whole.
What it is not
Three things people routinely mistake it for, and why each is wrong:
- Not the sale price. It’s an estimate of all owner-occupied homes’ worth, not the price of homes that actually sold this year. Recent sales in a hot market can be well above the self-reported median of every home, new and old, modest and grand.
- Not a Zillow-style estimate. Automated valuation models like the Zestimate use recent comparable sales and update constantly. The Census figure is a survey of what owners believe, pooled over five years. The two answer different questions and won’t match.
- Not a snapshot of one moment. Because the figures on this site are ACS 5-Year Estimates, the value reflects a five-year average of owners’ assessments, not today’s price. It’s stable and comparable across all 31,526 places — the trade-off for not being real-time.
None of this makes the number unreliable. It makes it a specific kind of measurement — a broad, consistent read on what a place’s owned housing is worth, in the eyes of the people who own it — that’s available everywhere, right down to small towns a commercial estimate would never cover.
The ceiling at the top
Like income, home value is top-coded for privacy. The survey stops recording values above $2,000,001, so a place shown at exactly that figure isn’t worth precisely two million — it means the true median is at least that high and the survey caps there. You’ll see this pin in the wealthiest enclaves, where a large share of homes exceed the ceiling. It’s the data being honest about the limit of what it can resolve, the same way it top-codes the highest incomes.
Reading it in context
A home value figure means little on its own. Its power comes from what you set it against.
The most revealing pairing is with income. Divide median home value by median household income and you get the home-value-to-income ratio — a useful quick gauge of local affordability, because it holds earnings constant and lets cost vary. Nationally that ratio is about 4.1 ($332,700 against an $80,734 income). Historically, under 3 was considered affordable and over 5 severely stretched — and real places range from under 3 to past 10, a spread we dig into in same paycheck, different life and the housing affordability cliff.
Two cautions keep the number honest. In small towns, home value is a survey estimate with a wide margin of error and, sometimes, too few owner-occupied homes to publish at all — read it as a range, not a precise figure. And remember it says nothing about property taxes, insurance, or HOA fees, which vary enormously and can make a cheaper-looking home more expensive to carry than a pricier one elsewhere — the gap the home affordability calculator is built to expose.
Used with those caveats in mind, the median home value is a genuinely powerful figure: a consistent, everywhere-available read on the cost of owned housing that pairs with income to tell you whether a place is within reach. Just remember what it actually is — owners’ own best guess at what their homes are worth — and you’ll read it for exactly what it can tell you, and not for what it can’t. The full method is on our methodology page, with terms defined in the glossary.
Updated September 4, 2026.
Figures in this article are drawn from the U.S. Census Bureau's 2020–2024 American Community Survey (ACS) 5-Year Estimates, the same source behind every city, county, and state profile on this site. Estimates pool five years of survey responses, so small differences between closely ranked places can fall within the margin of error. See our methodology and glossary for details.