Analysis
Renters and Owners: What Housing Tenure Reveals About a Place
Two-thirds of American households own their home. But in 216 of the country's larger cities, renters are the majority — and where that line falls tells you what kind of place you're looking at.
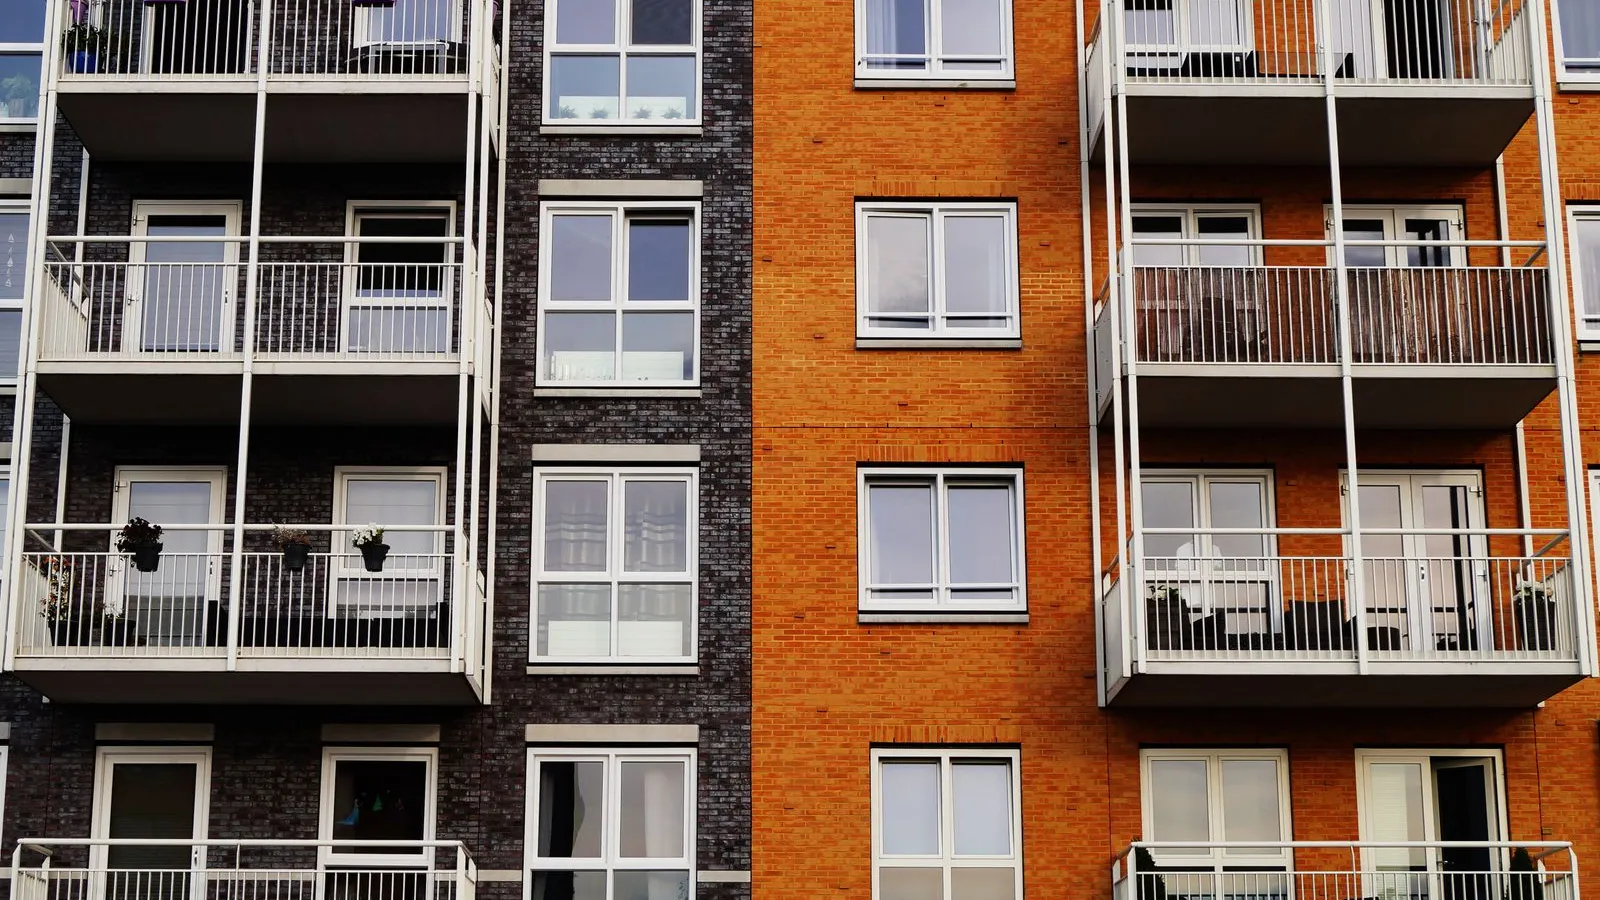
Among the many numbers in a demographic profile, one quietly explains more than its share: the split between households that own their home and those that rent. The Census Bureau calls it housing tenure, and it’s one of the most reliable tells for the character of a place — its age, its cost, its churn, and who gets to build wealth there.
Nationally, about 65% of occupied homes are owner-occupied. But that tidy two-thirds hides enormous variation, and the places that break from it break in patterns worth understanding.
What tenure counts, and what it doesn’t
Housing tenure is measured per occupied housing unit. Every occupied home is classified one of two ways: owner-occupied, meaning at least one occupant owns it (with or without a mortgage), or renter-occupied. The homeownership rate is simply the share that’s owner-occupied.
A few things it deliberately leaves out are worth naming. Tenure says nothing about whether the owner holds a mortgage or owns free and clear — a paid-off house and one with a $600,000 loan both count as owner-occupied. It ignores vacant units entirely, so a resort town packed with empty second homes can still post a high ownership rate among the few homes actually lived in year-round. And it’s a status, not a story: it can’t tell you whether a renter is a 24-year-old saving for a down payment or a family locked out of buying by prices. For that you read tenure alongside age, income, and home values — never alone.
The 65% country, and the cities that break it
Run the ownership rate across every larger city and the national average turns out to be a poor description of any particular place. Of the 876 cities with at least 50,000 people in our data, 216 — about one in four — are renter-majority, meaning more than half of occupied homes are rented rather than owned.
Widen the lens to every community of at least 1,000 residents and the count of renter-majority places reaches 1,661. These aren’t scattered at random. They cluster hard in a few kinds of place, and the cluster tells the story.
The most renter-heavy larger cities in the country are strikingly concentrated:
| City | Renter share | Population |
|---|---|---|
| Union City, NJ | 81% | 66,463 |
| Newark, NJ | 76% | 310,178 |
| Hartford, CT | 74% | 121,127 |
| New Haven, CT | 72% | 134,349 |
New Jersey and Connecticut’s older industrial cities dominate the top of the list — dense, historically working-class places built around apartments and multi-family housing long before the postwar suburbs. You can see the full national breakdown in our renter-majority cities analysis.
Why a place becomes renter-majority
Three forces push a place toward renting, and most renter-majority cities have at least two of them.
Density and housing stock. A place built around apartment buildings and rowhouses simply has more rentable units than a place built around single-family lots. Housing form is close to destiny here: you cannot have a nation of homeowners in a city made of apartments.
Cost. In the most expensive coastal metros, ownership isn’t a preference so much as a threshold — when the median home costs eight or ten times local income, renting is the only door most households can walk through, however much they’d rather buy. High-cost cities tend to be renter cities not because their residents are poorer, but because the buy-in is out of reach.
Age and transience. College towns and job-magnet cities full of young adults early in their careers rent because that’s the life stage — mobile, unsettled, not yet buying. These places can be quite affluent and still rent-dominated.
Notice that these pull in different directions. Union City rents because it’s dense and working-class; a tech hub full of young professionals rents because it’s expensive and mobile. Same tenure number, opposite economics — which is exactly why tenure has to be read with income and age beside it.
The other extreme: the ownership belt
If dense coastal cities anchor the renter end, the most owner-dominated large cities cluster in the Sun Belt’s master-planned suburbs. Among cities of at least 100,000 people, homeownership tops out around 80 to 83%:
| City | Homeownership |
|---|---|
| Port St. Lucie, FL | 84% |
| Rio Rancho, NM | 82% |
| San Tan Valley, AZ | 82% |
| Centennial, CO | 81% |
| Sugar Land, TX | 80% |
These are the mirror image of the renter cities: newer, lower-density, built around single-family subdivisions, and priced affordably enough against local incomes that buying is simply the default. Housing form and cost point the same direction here too — just the opposite one.
What tenure predicts
The reason housing tenure earns so much attention is that it correlates with things people care about deeply.
The biggest is wealth. For most American families, home equity is the single largest asset they’ll ever hold — a forced savings account that builds automatically as a mortgage gets paid down and prices rise. Renters, however stable their income, are largely shut out of that particular engine. A place’s tenure split is, in part, a map of who gets to accumulate housing wealth and who doesn’t, which is why the ownership gap tracks so closely with racial and generational wealth gaps.
Tenure also shapes a place’s stability and politics. Owners move less often, which makes for lower residential churn and thicker long-term community ties; renters move more, keeping a place younger and more fluid. Neither is better — a healthy region needs both the mobility that rental housing enables and the rootedness ownership brings — but they make for different kinds of neighborhoods.
Nationally, homeownership rates run highest in states with cheaper housing and older populations — West Virginia and Maine top the list at around 74% — and lowest in expensive coastal states and, most of all, in the District of Columbia, where barely four in ten homes are owner-occupied. High cost and dense housing both push the same direction.
So when you pull up a place and see its tenure split, read it as a compact summary of several things at once: what the housing is made of, what it costs to buy in, how settled the population is, and who’s positioned to build wealth. Few single numbers pack as much in. The homeownership rankings and each city’s own profile let you see where any place lands.
Updated September 4, 2026.
Figures in this article are drawn from the U.S. Census Bureau's 2020–2024 American Community Survey (ACS) 5-Year Estimates, the same source behind every city, county, and state profile on this site. Estimates pool five years of survey responses, so small differences between closely ranked places can fall within the margin of error. See our methodology and glossary for details.